Los Altos

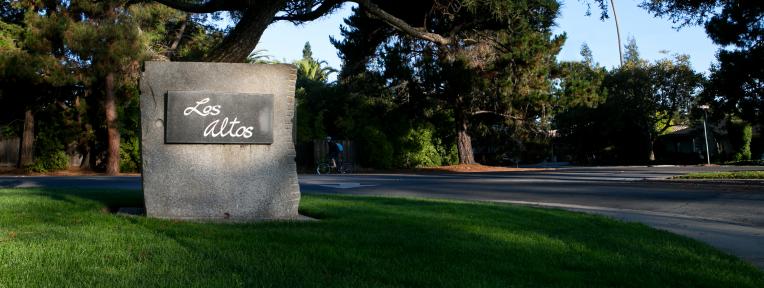
Apricot trees, towering redwoods,  fragrant pines, and other lush foliage grace the streets and avenues of Los Altos City, adding to its reputation as one of South Bay’s more desirable addresses. This lovely community is essentially built out, serving as a residential haven for a social mix of managers, administrators, retirees, and professionals. The community’s pleasing ambiance stems in part from its genesis as a vacation spot, summer getaway, and second home for San Francisco’s wealthy.

Most of the housing consists of single-family homes, many of which enjoy spacious quarter-acre lots. Sidewalks are few, preserving an upscale version of country flavor along many of the streets. Shopping centers are plentiful and attractive, including a downtown district that offers first-rate restaurants, bakeries, sidewalk cafes, boutiques, and fine art galleries.

The public school system enjoys an excellent reputation, featuring elementary schools that have been designated as “distinguished” by the state. Community members are aware and proud of their home, and are known for their generous support of schools and libraries. In spite of the elegant Spanish name meaning “The Hills,” the topography of Los Altos is relatively flat, sloping gently toward the Bay.


Country Club (30-day trend)
 
Number of Properties
Avg Price
Avg $/SQFT
Avg DOM
% of Avg Sold Price/Avg List Price
Active
2 (Number of Properties)
$4,874,823 (Avg Price)
$1,487 (Avg $/SQFT)
11 (Avg DOM)
Sold
1 (Number of Properties)
$6,469,523 (Avg Price)
$1,646 (Avg $/SQFT)
21 (Avg DOM)
102% (% of Avg Sold Price/Avg List Price)
Highlands (30-day trend)
 
Number of Properties
Avg Price
Avg $/SQFT
Avg DOM
% of Avg Sold Price/Avg List Price
Active
5 (Number of Properties)
$4,315,142 (Avg Price)
$1,349 (Avg $/SQFT)
9 (Avg DOM)
Sold
3 (Number of Properties)
$3,898,552 (Avg Price)
$1,584 (Avg $/SQFT)
24 (Avg DOM)
101% (% of Avg Sold Price/Avg List Price)
North Los Altos (30-day trend)
 
Number of Properties
Avg Price
Avg $/SQFT
Avg DOM
% of Avg Sold Price/Avg List Price
Active
31 (Number of Properties)
$3,055,403 (Avg Price)
$1,839 (Avg $/SQFT)
46 (Avg DOM)
Sold
10 (Number of Properties)
$4,186,527 (Avg Price)
$1,695 (Avg $/SQFT)
31 (Avg DOM)
103% (% of Avg Sold Price/Avg List Price)
South of El Monte (30-day trend)
 
Number of Properties
Avg Price
Avg $/SQFT
Avg DOM
% of Avg Sold Price/Avg List Price
Active
9 (Number of Properties)
$5,320,847 (Avg Price)
$1,680 (Avg $/SQFT)
55 (Avg DOM)
Sold
15 (Number of Properties)
$4,114,385 (Avg Price)
$1,975 (Avg $/SQFT)
35 (Avg DOM)
107% (% of Avg Sold Price/Avg List Price)

Property Info