PHONE  :  408.410.5645
EMAIL  :  info@wolffgroup.biz

San Jose


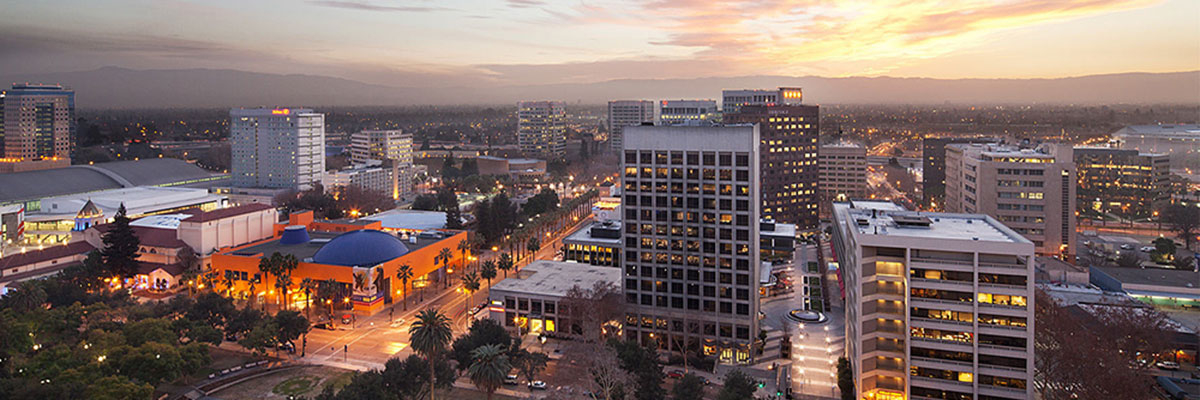
The largest of Santa Clara County  communities, San Jose, was ranked among Money Magazine’s list of most livable cities–common recognition. The dominance of middle-class income levels and attitudes have preserved an enviable quality of life for San Jose residents in spite of astronomical growth patterns. While San Jose rapidly approaches the million mark in population, it towers as a high-tech giant in the Bay Area with a proven attitude of vitality.


Tract developments dominate the scene, a neighborhood atmosphere that outsiders often label as “land” to the chagrin of loyal residents. What may be lacking in style or innovative architecture is usually off-set by lush landscaping and interior decorating. In cultural amenities as well as in high-tech leadership, San Jose shines. It seems that the world-class amenities that were once relegated to San Francisco have ‘found the way’ to San Jose, including professional sports teams, international stars, symphony, opera, light opera, ballet, and repertory theatre.


A good place for growing families, San Jose offers an exceptional children’s discovery museum, lovely parks, and many sports and athletic programs. Creating a more closely knit atmosphere than most large cities manage to provide, San Jose is home to a number of welcoming neighborhoods that cater to their own restaurants, theaters, and shops.


San Jose
Municipal Offices
408-535-3500
www.sanjoseca.gov


Chamber of Commerce
408-291-5250
www.sjchamber.com

Market Reports

Santa Teresa (30-day trend)
 
Number of Properties
Avg Price
Avg $/SQFT
Avg DOM
% of Avg Sold Price/Avg List Price
Active
20 (Number of Properties)
$1,378,468 (Avg Price)
$939 (Avg $/SQFT)
56 (Avg DOM)
Sold
19 (Number of Properties)
$1,385,993 (Avg Price)
$778 (Avg $/SQFT)
47 (Avg DOM)
104% (% of Avg Sold Price/Avg List Price)
South San Jose (30-day trend)
 
Number of Properties
Avg Price
Avg $/SQFT
Avg DOM
% of Avg Sold Price/Avg List Price
Active
23 (Number of Properties)
$1,183,782 (Avg Price)
$822 (Avg $/SQFT)
53 (Avg DOM)
Sold
29 (Number of Properties)
$1,020,200 (Avg Price)
$716 (Avg $/SQFT)
46 (Avg DOM)
104% (% of Avg Sold Price/Avg List Price)
Almaden Valley (30-day trend)
 
Number of Properties
Avg Price
Avg $/SQFT
Avg DOM
% of Avg Sold Price/Avg List Price
Active
5 (Number of Properties)
$2,622,916 (Avg Price)
$974 (Avg $/SQFT)
46 (Avg DOM)
Sold
19 (Number of Properties)
$2,239,334 (Avg Price)
$950 (Avg $/SQFT)
49 (Avg DOM)
103% (% of Avg Sold Price/Avg List Price)
Cambrian (30-day trend)
 
Number of Properties
Avg Price
Avg $/SQFT
Avg DOM
% of Avg Sold Price/Avg List Price
Active
13 (Number of Properties)
$1,491,553 (Avg Price)
$913 (Avg $/SQFT)
35 (Avg DOM)
Sold
39 (Number of Properties)
$1,706,526 (Avg Price)
$1,144 (Avg $/SQFT)
45 (Avg DOM)
105% (% of Avg Sold Price/Avg List Price)
Central San Jose (30-day trend)
 
Number of Properties
Avg Price
Avg $/SQFT
Avg DOM
% of Avg Sold Price/Avg List Price
Active
57 (Number of Properties)
$1,020,015 (Avg Price)
$757 (Avg $/SQFT)
77 (Avg DOM)
Sold
40 (Number of Properties)
$1,285,441 (Avg Price)
$882 (Avg $/SQFT)
50 (Avg DOM)
102% (% of Avg Sold Price/Avg List Price)
Alum Rock (30-day trend)
 
Number of Properties
Avg Price
Avg $/SQFT
Avg DOM
% of Avg Sold Price/Avg List Price
Active
41 (Number of Properties)
$1,162,644 (Avg Price)
$770 (Avg $/SQFT)
65 (Avg DOM)
Sold
31 (Number of Properties)
$1,117,891 (Avg Price)
$758 (Avg $/SQFT)
59 (Avg DOM)
101% (% of Avg Sold Price/Avg List Price)
Alviso (Santa Clara County) (30-day trend)
 
Number of Properties
Avg Price
Avg $/SQFT
Avg DOM
% of Avg Sold Price/Avg List Price
Active
1 (Number of Properties)
$1,143,384 (Avg Price)
$1,052 (Avg $/SQFT)
13 (Avg DOM)
Sold
2 (Number of Properties)
$1,105,967 (Avg Price)
$905 (Avg $/SQFT)
50 (Avg DOM)
104% (% of Avg Sold Price/Avg List Price)
Blossom Valley (30-day trend)
 
Number of Properties
Avg Price
Avg $/SQFT
Avg DOM
% of Avg Sold Price/Avg List Price
Active
18 (Number of Properties)
$1,069,354 (Avg Price)
$797 (Avg $/SQFT)
50 (Avg DOM)
Sold
52 (Number of Properties)
$1,314,295 (Avg Price)
$834 (Avg $/SQFT)
45 (Avg DOM)
103% (% of Avg Sold Price/Avg List Price)
Evergreen (30-day trend)
 
Number of Properties
Avg Price
Avg $/SQFT
Avg DOM
% of Avg Sold Price/Avg List Price
Active
22 (Number of Properties)
$1,236,981 (Avg Price)
$634 (Avg $/SQFT)
63 (Avg DOM)
Sold
34 (Number of Properties)
$1,742,994 (Avg Price)
$805 (Avg $/SQFT)
49 (Avg DOM)
102% (% of Avg Sold Price/Avg List Price)
Willow Glen (30-day trend)
 
Number of Properties
Avg Price
Avg $/SQFT
Avg DOM
% of Avg Sold Price/Avg List Price
Active
23 (Number of Properties)
$1,983,148 (Avg Price)
$998 (Avg $/SQFT)
49 (Avg DOM)
Sold
39 (Number of Properties)
$2,110,897 (Avg Price)
$1,098 (Avg $/SQFT)
52 (Avg DOM)
104% (% of Avg Sold Price/Avg List Price)

Property Info